What explains the gender pay gap?
Some factors widen the gender pay gap. Others narrow it. That is why a single headline number tells only part of the story.
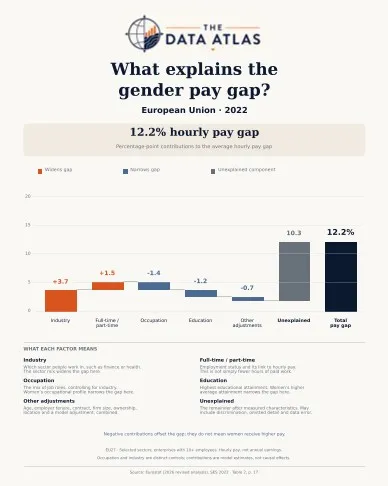
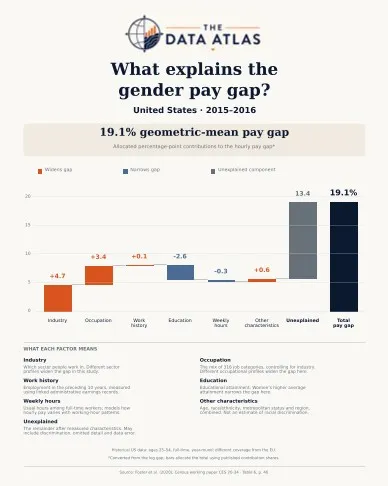
These two waterfalls unpack the contributions estimated in separate EU and US studies:
- Industry matters: women and men work in different sectors with different pay levels.
- Education offsets part of the gap in both studies.
- Occupational profiles narrow the gap in the EU analysis but widen it in the US study.
What “unexplained” means
The remaining “unexplained” component is what the models cannot account for using their measured characteristics. It may include discrimination, unmeasured differences and data limitations.
And “explained” does not mean fair: access to occupations, promotions and career opportunities can itself be unequal.
About the data
Scope: EU data from 2022; US data from 2015–16. Different populations and methods mean these are separate illustrations, not a like-for-like comparison. US contributions are proportionally allocated from the study’s log-wage decomposition.
Countries in this post
Discuss on LinkedIn
Which part of the breakdown surprised you most?