Violent or nonviolent: which protests succeed?
Do violent protests achieve more than nonviolent ones?
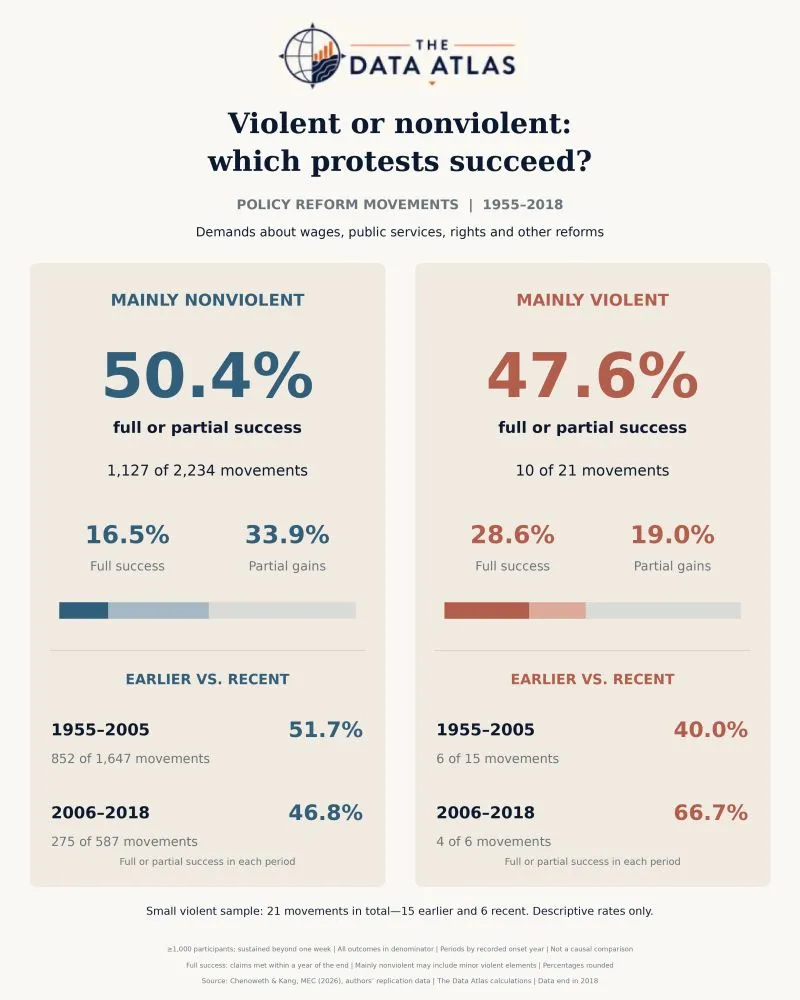
A comparison of 2,255 major movements seeking policy reforms shows:
- Mainly nonviolent: 50.4% achieved full or partial success.
- Mainly violent: 47.6%.
But the sample sizes tell an essential part of the story: 2,234 nonviolent movements versus just 21 violent ones.
What changed over time?
Between 1955–2005 and 2006–2018:
- Nonviolent movements: 51.7% → 46.8%.
- Violent movements: 40.0% → 66.7%.
That apparent rise for violent movements comes from just 4 successes among 6 recent cases. It cannot establish that violence became more effective.
About the data
The comparison covers demands about wages, public services, rights and other reforms. “Success” consistently includes both full achievement and partial gains.
These are sustained movements involving at least 1,000 participants—not every demonstration. Classification follows the predominant method, so mainly nonviolent movements can include minor violent elements. Differences in context, reporting and unresolved outcomes also limit comparisons.
The figures describe historical outcomes; they do not prove that choosing a tactic causes success.
The figures from the chart
| Movements and period | Successful movements | All movements | Full or partial success | Full success | Partial gains |
|---|---|---|---|---|---|
| Mainly nonviolent, 1955–2018 | 1,127 | 2,234 | 50.4% | 16.5% | 33.9% |
| Mainly nonviolent, 1955–2005 | 852 | 1,647 | 51.7% | not broken down in the chart | not broken down in the chart |
| Mainly nonviolent, 2006–2018 | 275 | 587 | 46.8% | not broken down in the chart | not broken down in the chart |
| Mainly violent, 1955–2018 | 10 | 21 | 47.6% | 28.6% | 19.0% |
| Mainly violent, 1955–2005 | 6 | 15 | 40.0% | not broken down in the chart | not broken down in the chart |
| Mainly violent, 2006–2018 | 4 | 6 | 66.7% | not broken down in the chart | not broken down in the chart |
Periods by recorded onset year. Percentages rounded.
Discuss on LinkedIn
What should count as protest success: full achievement, partial concessions, or lasting influence on policy?