Who depends on whom?
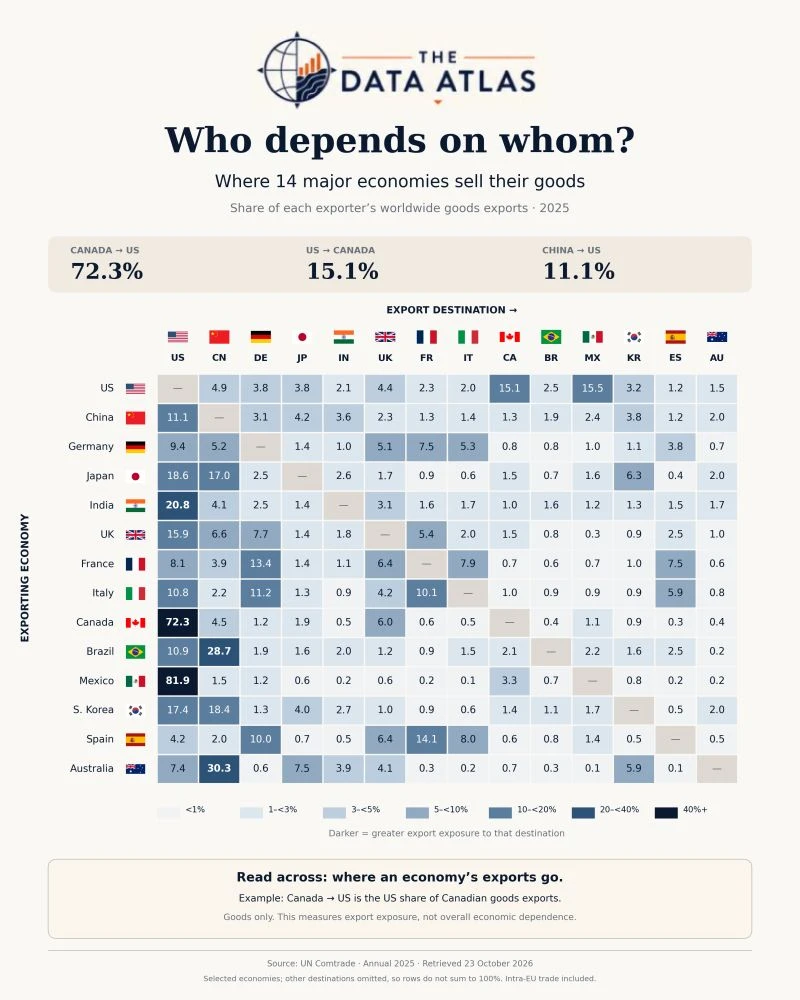
Canada sends 72% of its goods exports to the US. The reverse? Just 15%. Trade relationships are rarely balanced—and export dependence is often even less so.
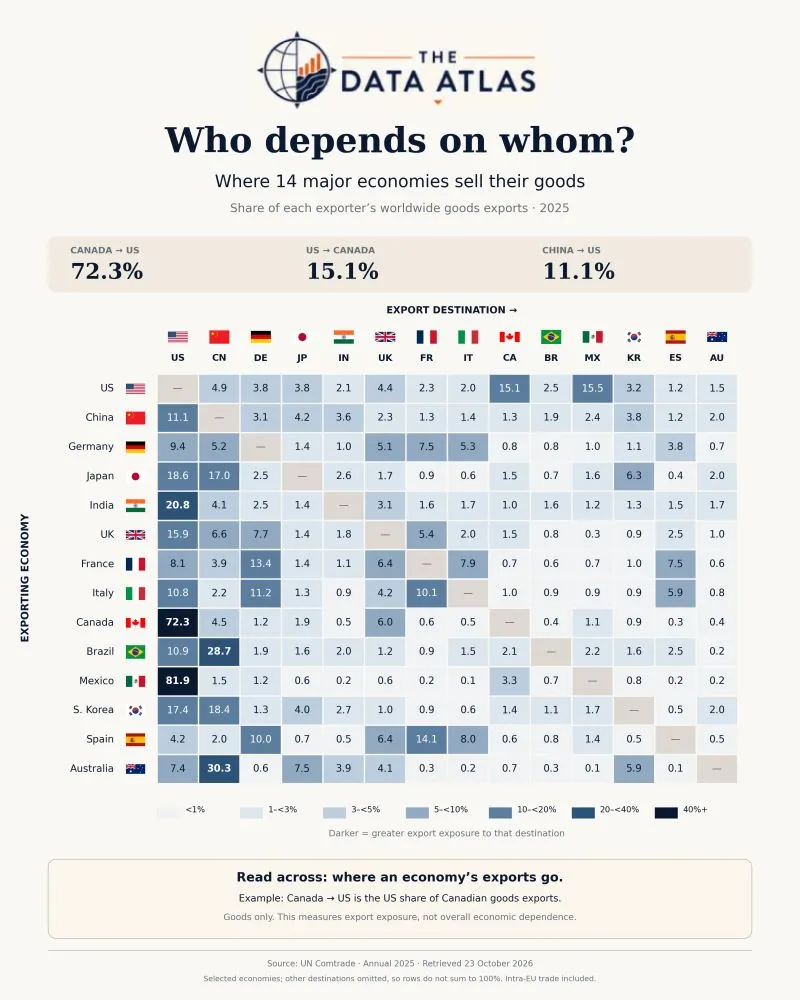
This heatmap shows where 14 major economies sell their goods:
- Mexico sends 81.9% of its goods exports to the US.
- Australia sends 30.3% to China.
- China sends 11.1% to the US, while the US sends 4.9% to China.
How to read it
Read across each row: every number is the destination’s share of that economy’s worldwide goods exports.
The takeaway: the same trading relationship can carry very different weight on either side.
About the data
Goods only, 2025. This measures export exposure, not overall economic dependence. Destinations outside the chart are included in the denominator.
Explore the trade links
The data behind the infographic above. Sort, filter or select a row for details.
Share of exports:<1%1–<3%3–<5%5–<10%10–<20%20–<40%40%+
Left: rank 0 (best). Right: rank 15.5.


Where 14 major economies sell their goods, 2025: each destination's share of the exporter's worldwide goods exports (%). Read across each row.
| Exporter | United States | China | Germany | Japan | India | United Kingdom | France | Italy | Canada | Brazil | Mexico | South Korea | Spain | Australia |
|---|---|---|---|---|---|---|---|---|---|---|---|---|---|---|
| US | own country | 4.9 | 3.8 | 3.8 | 2.1 | 4.4 | 2.3 | 2.0 | 15.1 | 2.5 | 15.5 | 3.2 | 1.2 | 1.5 |
| China | 11.1 | own country | 3.1 | 4.2 | 3.6 | 2.3 | 1.3 | 1.4 | 1.3 | 1.9 | 2.4 | 3.8 | 1.2 | 2.0 |
| Germany | 9.4 | 5.2 | own country | 1.4 | 1.0 | 5.1 | 7.5 | 5.3 | 0.8 | 0.8 | 1.0 | 1.1 | 3.8 | 0.7 |
| Japan | 18.6 | 17.0 | 2.5 | own country | 2.6 | 1.7 | 0.9 | 0.6 | 1.5 | 0.7 | 1.6 | 6.3 | 0.4 | 2.0 |
| India | 20.8 | 4.1 | 2.5 | 1.4 | own country | 3.1 | 1.6 | 1.7 | 1.0 | 1.6 | 1.2 | 1.3 | 1.5 | 1.7 |
| UK | 15.9 | 6.6 | 7.7 | 1.4 | 1.8 | own country | 5.4 | 2.0 | 1.5 | 0.8 | 0.3 | 0.9 | 2.5 | 1.0 |
| France | 8.1 | 3.9 | 13.4 | 1.4 | 1.1 | 6.4 | own country | 7.9 | 0.7 | 0.6 | 0.7 | 1.0 | 7.5 | 0.6 |
| Italy | 10.8 | 2.2 | 11.2 | 1.3 | 0.9 | 4.2 | 10.1 | own country | 1.0 | 0.9 | 0.9 | 0.9 | 5.9 | 0.8 |
| Canada | 72.3 | 4.5 | 1.2 | 1.9 | 0.5 | 6.0 | 0.6 | 0.5 | own country | 0.4 | 1.1 | 0.9 | 0.3 | 0.4 |
| Brazil | 10.9 | 28.7 | 1.9 | 1.6 | 2.0 | 1.2 | 0.9 | 1.5 | 2.1 | own country | 2.2 | 1.6 | 2.5 | 0.2 |
| Mexico | 81.9 | 1.5 | 1.2 | 0.6 | 0.2 | 0.6 | 0.2 | 0.1 | 3.3 | 0.7 | own country | 0.8 | 0.2 | 0.2 |
| S. Korea | 17.4 | 18.4 | 1.3 | 4.0 | 2.7 | 1.0 | 0.9 | 0.6 | 1.4 | 1.1 | 1.7 | own country | 0.5 | 2.0 |
| Spain | 4.2 | 2.0 | 10.0 | 0.7 | 0.5 | 6.4 | 14.1 | 8.0 | 0.6 | 0.8 | 1.4 | 0.5 | own country | 0.5 |
| Australia | 7.4 | 30.3 | 0.6 | 7.5 | 3.9 | 4.1 | 0.3 | 0.2 | 0.7 | 0.3 | 0.1 | 5.9 | 0.1 | own country |
Goods only. Selected economies; other destinations omitted, so rows do not sum to 100%. Intra-EU trade included.
Countries in this post
Discuss on LinkedIn
Which relationship would you have expected to be more balanced?