Did households get richer?
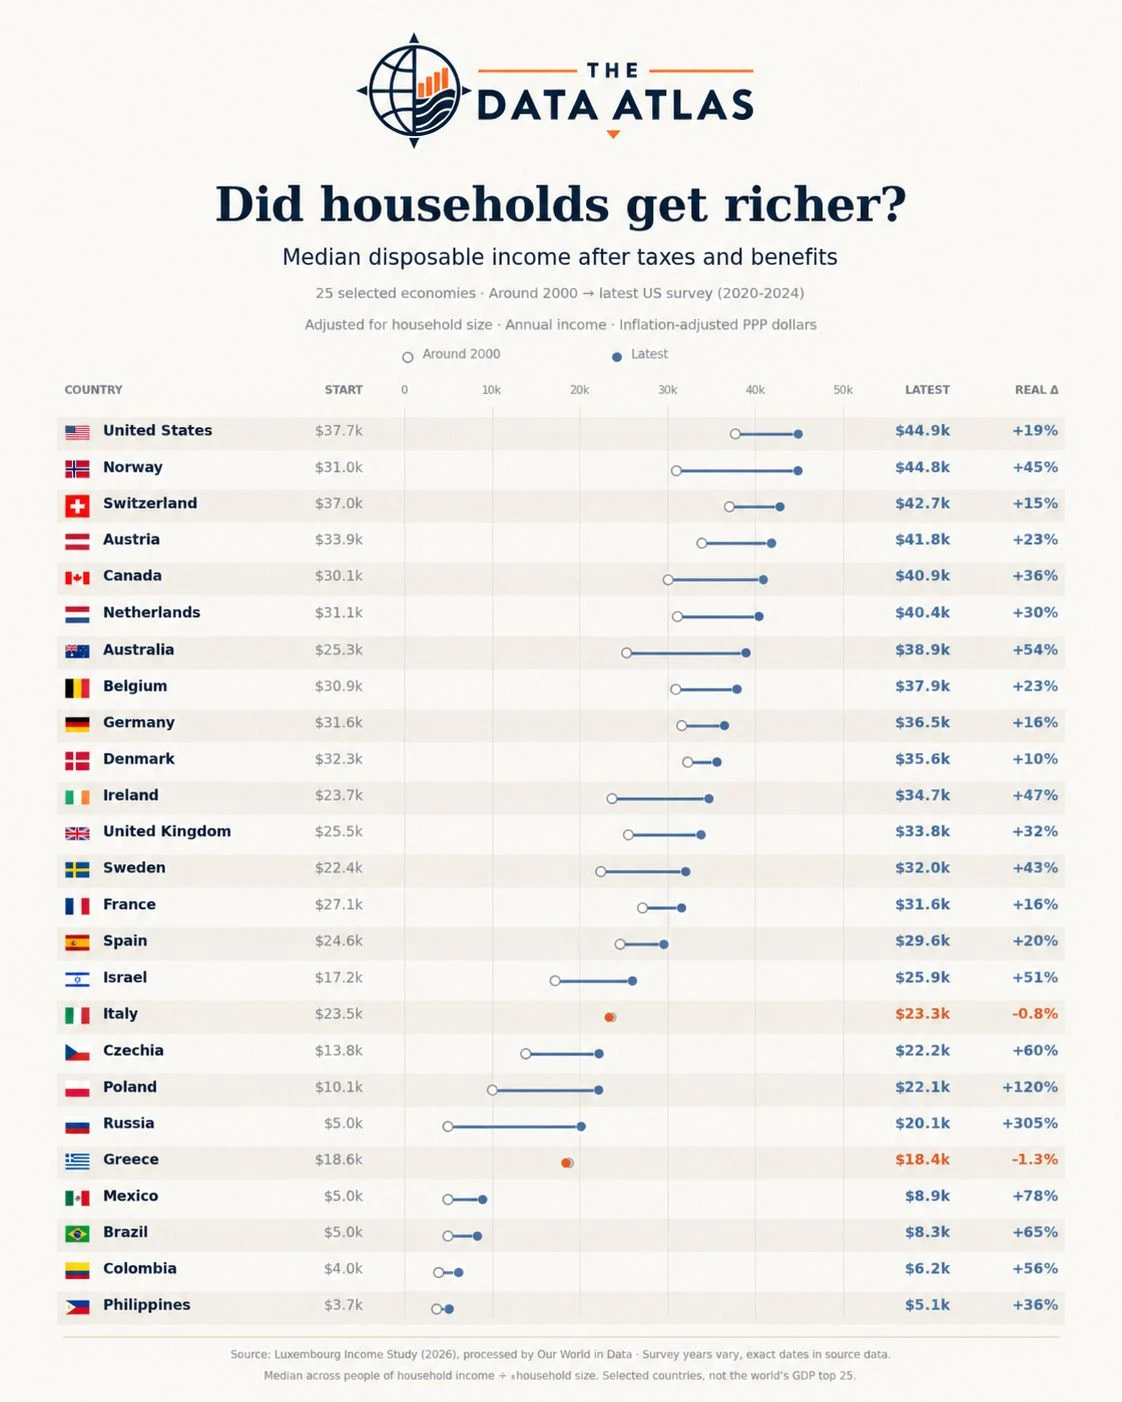
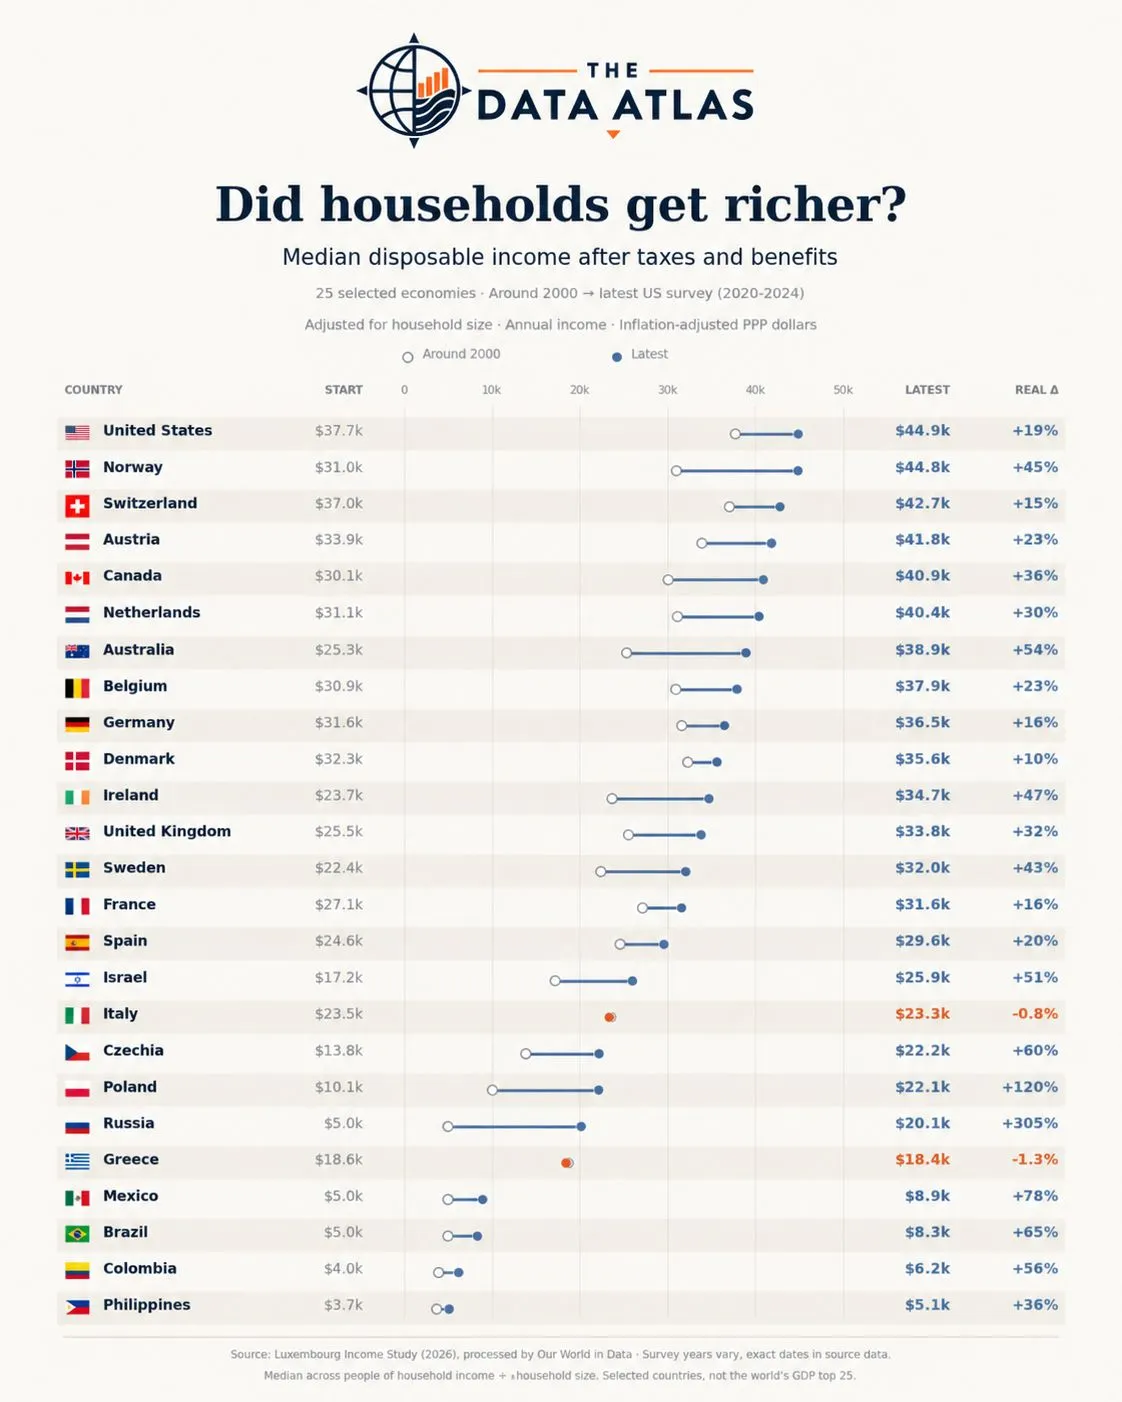
Did households get richer—or did the numbers just get bigger? Adjusting for inflation reveals very different stories across 25 selected economies since around 2000.
Key figures
- Poland: median disposable income rose approximately 120%.
- Czechia: up 60%.
- United Kingdom: up 32%.
- United States: up 19%.
- Italy and Greece: little change, with small declines.
The US has the highest latest income level among the countries shown. But some countries starting from much lower levels recorded considerably faster growth.
How to read it
This chart measures income after taxes and benefits, adjusted for household size, inflation and differences in purchasing power. It captures the middle of the distribution, rather than the average.
About the data
The comparison runs from around 2000 to each country’s latest available observation, between 2020 and 2024. These are 25 selected economies with suitable data—not the world’s complete GDP top 25.
Explore the figures
The data behind the infographic above. Sort, filter or select a row for details.
LatestAround 2000 (in brackets)Real change below zero
Below zeroAbove zero
Left: rank 0 (best). Right: rank 44.9.


Median disposable household income, around 2000 and latest survey (2020–2024), in inflation-adjusted PPP dollars per year, and the real change.
| Country | Around 2000 | Latest | Real change |
|---|---|---|---|
| United States | $37.7k | $44.9k | +19% |
| Norway | $31.0k | $44.8k | +45% |
| Switzerland | $37.0k | $42.7k | +15% |
| Austria | $33.9k | $41.8k | +23% |
| Canada | $30.1k | $40.9k | +36% |
| Netherlands | $31.1k | $40.4k | +30% |
| Australia | $25.3k | $38.9k | +54% |
| Belgium | $30.9k | $37.9k | +23% |
| Germany | $31.6k | $36.5k | +16% |
| Denmark | $32.3k | $35.6k | +10% |
| Ireland | $23.7k | $34.7k | +47% |
| United Kingdom | $25.5k | $33.8k | +32% |
| Sweden | $22.4k | $32.0k | +43% |
| France | $27.1k | $31.6k | +16% |
| Spain | $24.6k | $29.6k | +20% |
| Israel | $17.2k | $25.9k | +51% |
| Italy | $23.5k | $23.3k | −0.8% |
| Czechia | $13.8k | $22.2k | +60% |
| Poland | $10.1k | $22.1k | +120% |
| Russia | $5.0k | $20.1k | +305% |
| Greece | $18.6k | $18.4k | −1.3% |
| Mexico | $5.0k | $8.9k | +78% |
| Brazil | $5.0k | $8.3k | +65% |
| Colombia | $4.0k | $6.2k | +56% |
| Philippines | $3.7k | $5.1k | +36% |
Annual income after taxes and benefits, adjusted for household size; median across people. Survey years vary. Selected countries, not the world's GDP top 25.