Who pays into the EU?
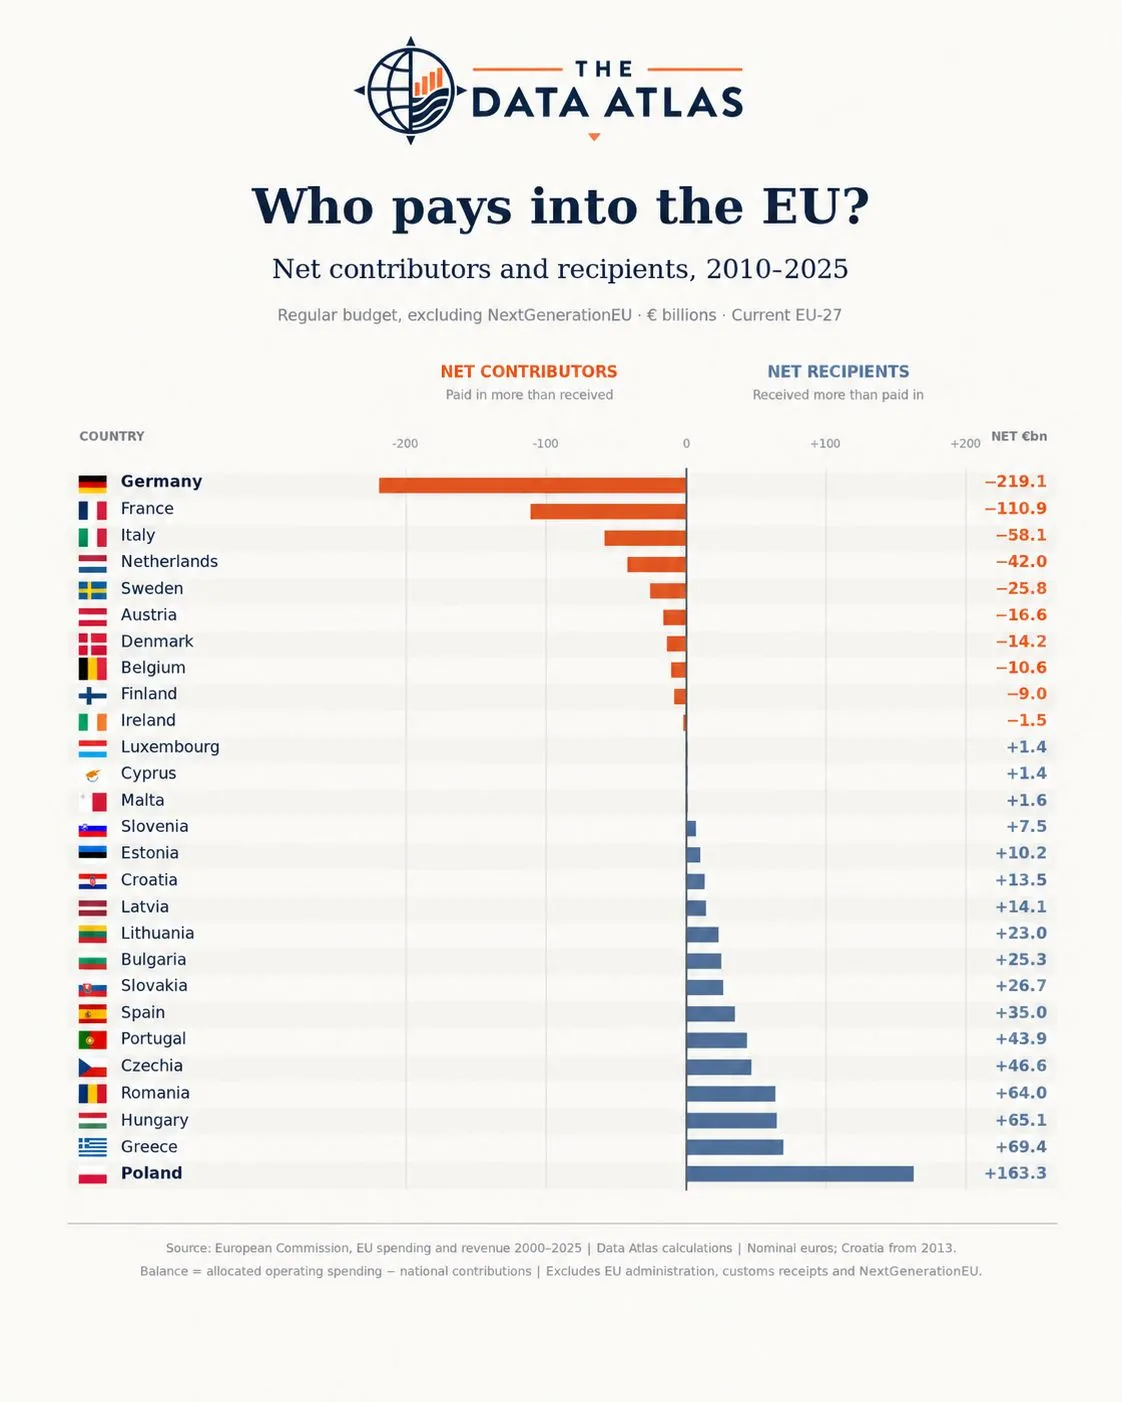
Who pays into the EU budget—and who receives more than they contribute? Adding up 2010–2025 reveals the scale of the differences.
Largest net contributors
- Germany: €219.1 billion
- France: €110.9 billion
- Italy: €58.1 billion
Largest net recipients
- Poland: €163.3 billion
- Greece: €69.4 billion
- Hungary: €65.1 billion
- Romania: €64.0 billion
How to read it
These are cumulative totals, so country size matters. A ranking per resident would tell a different story.
And a budget balance cannot tell us the full economic value of EU membership: trade, investment and cross-border benefits extend well beyond money allocated to individual countries.
About the data
The chart covers today’s EU-27. Balances equal country-allocated operating spending minus national contributions, excluding customs duties. EU administration and NextGenerationEU are excluded. Figures are nominal euros; Croatia is included from 2013.
The figures from the chart
| Country | Net balance€ bn |
|---|---|
| Germany | −219.1 |
| France | −110.9 |
| Italy | −58.1 |
| Netherlands | −42.0 |
| Sweden | −25.8 |
| Austria | −16.6 |
| Denmark | −14.2 |
| Belgium | −10.6 |
| Finland | −9.0 |
| Ireland | −1.5 |
| Luxembourg | +1.4 |
| Cyprus | +1.4 |
| Malta | +1.6 |
| Slovenia | +7.5 |
| Estonia | +10.2 |
| Croatia | +13.5 |
| Latvia | +14.1 |
| Lithuania | +23.0 |
| Bulgaria | +25.3 |
| Slovakia | +26.7 |
| Spain | +35.0 |
| Portugal | +43.9 |
| Czechia | +46.6 |
| Romania | +64.0 |
| Hungary | +65.1 |
| Greece | +69.4 |
| Poland | +163.3 |
Regular budget, excluding NextGenerationEU. Balance = allocated operating spending − national contributions; excludes EU administration and customs receipts. Croatia from 2013.
Countries in this post
Discuss on LinkedIn
Which country’s position surprised you most?